


Some of the DMs and comments I received in the past were mainly about this: “how do you create those nice-looking infographics on your linkedin posts and some of the substack articles?”
I used to spend a bunch of time on them before actually realizing I could automate the entire process start to end.
I think it’s time to answer how I do it, and here’s a quick example of what I mean by the word infographic (you’ve probably seen it around on other creators’ posts as well):
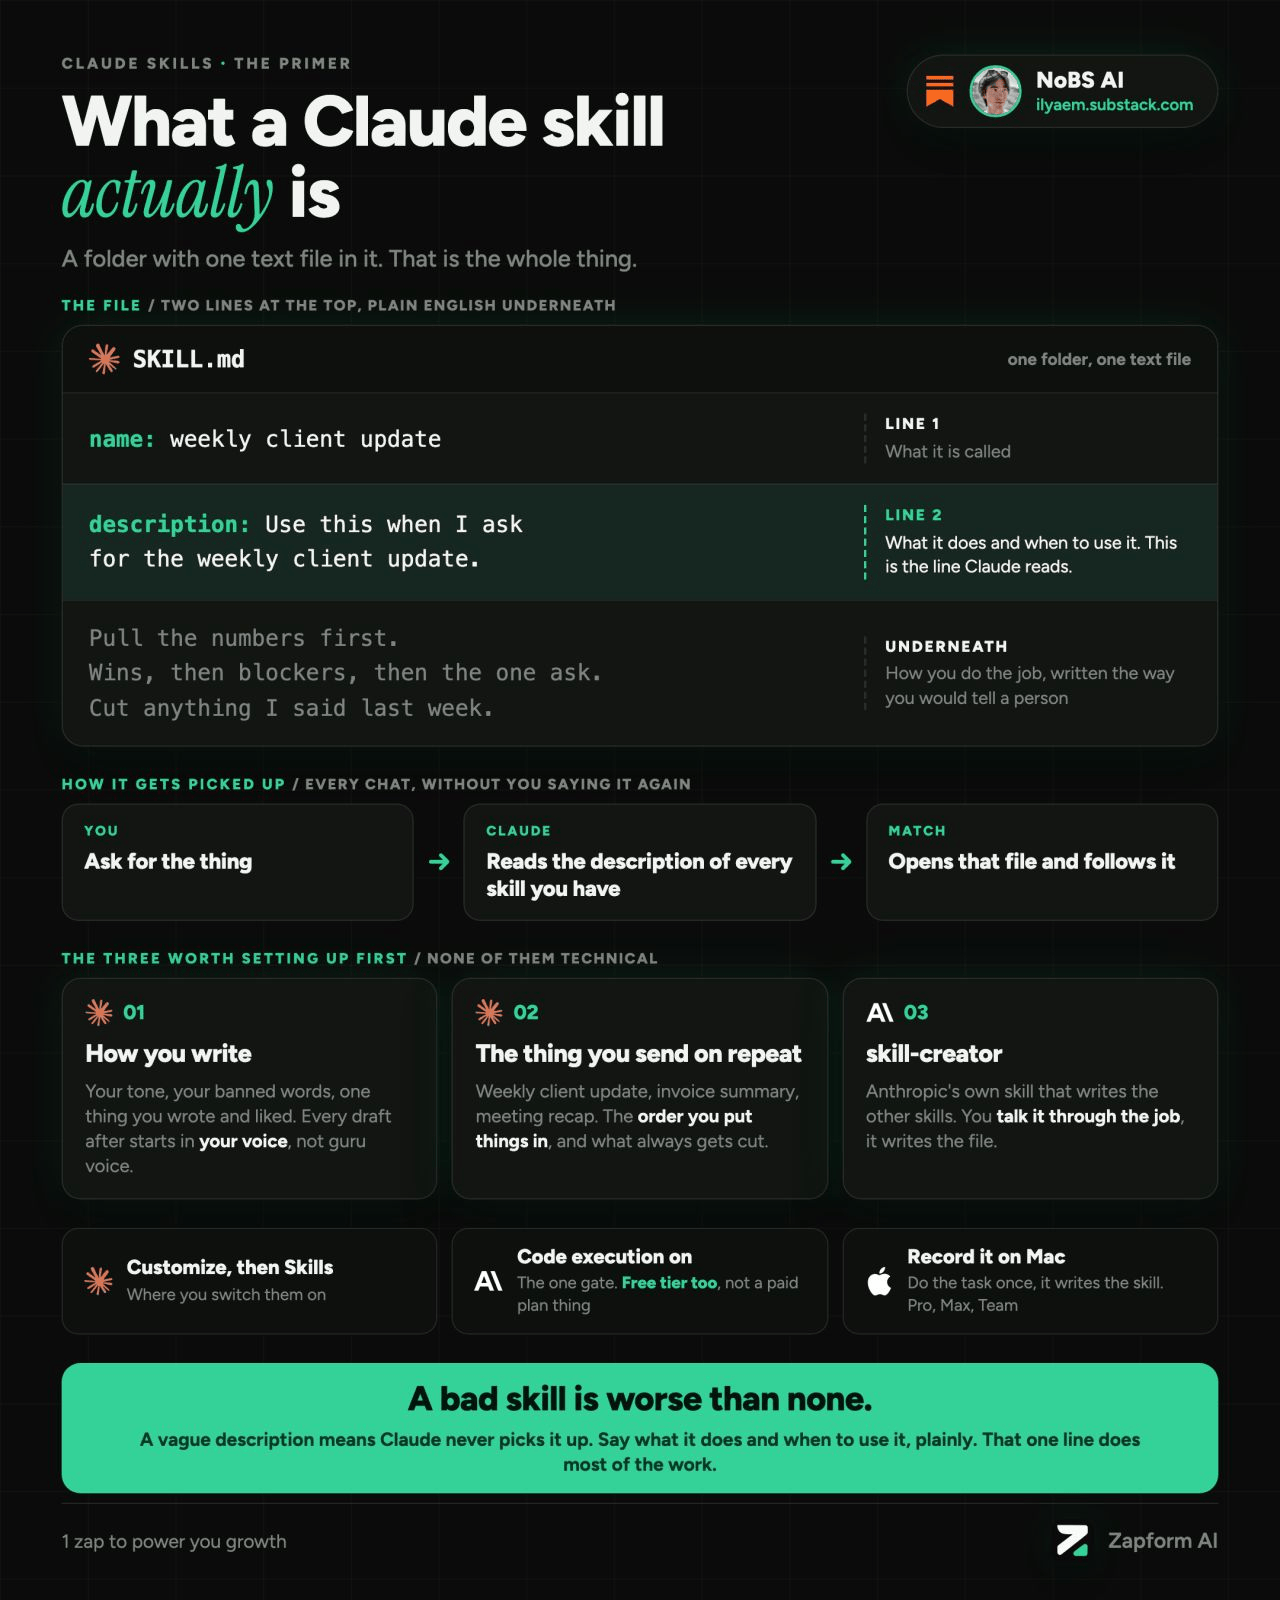
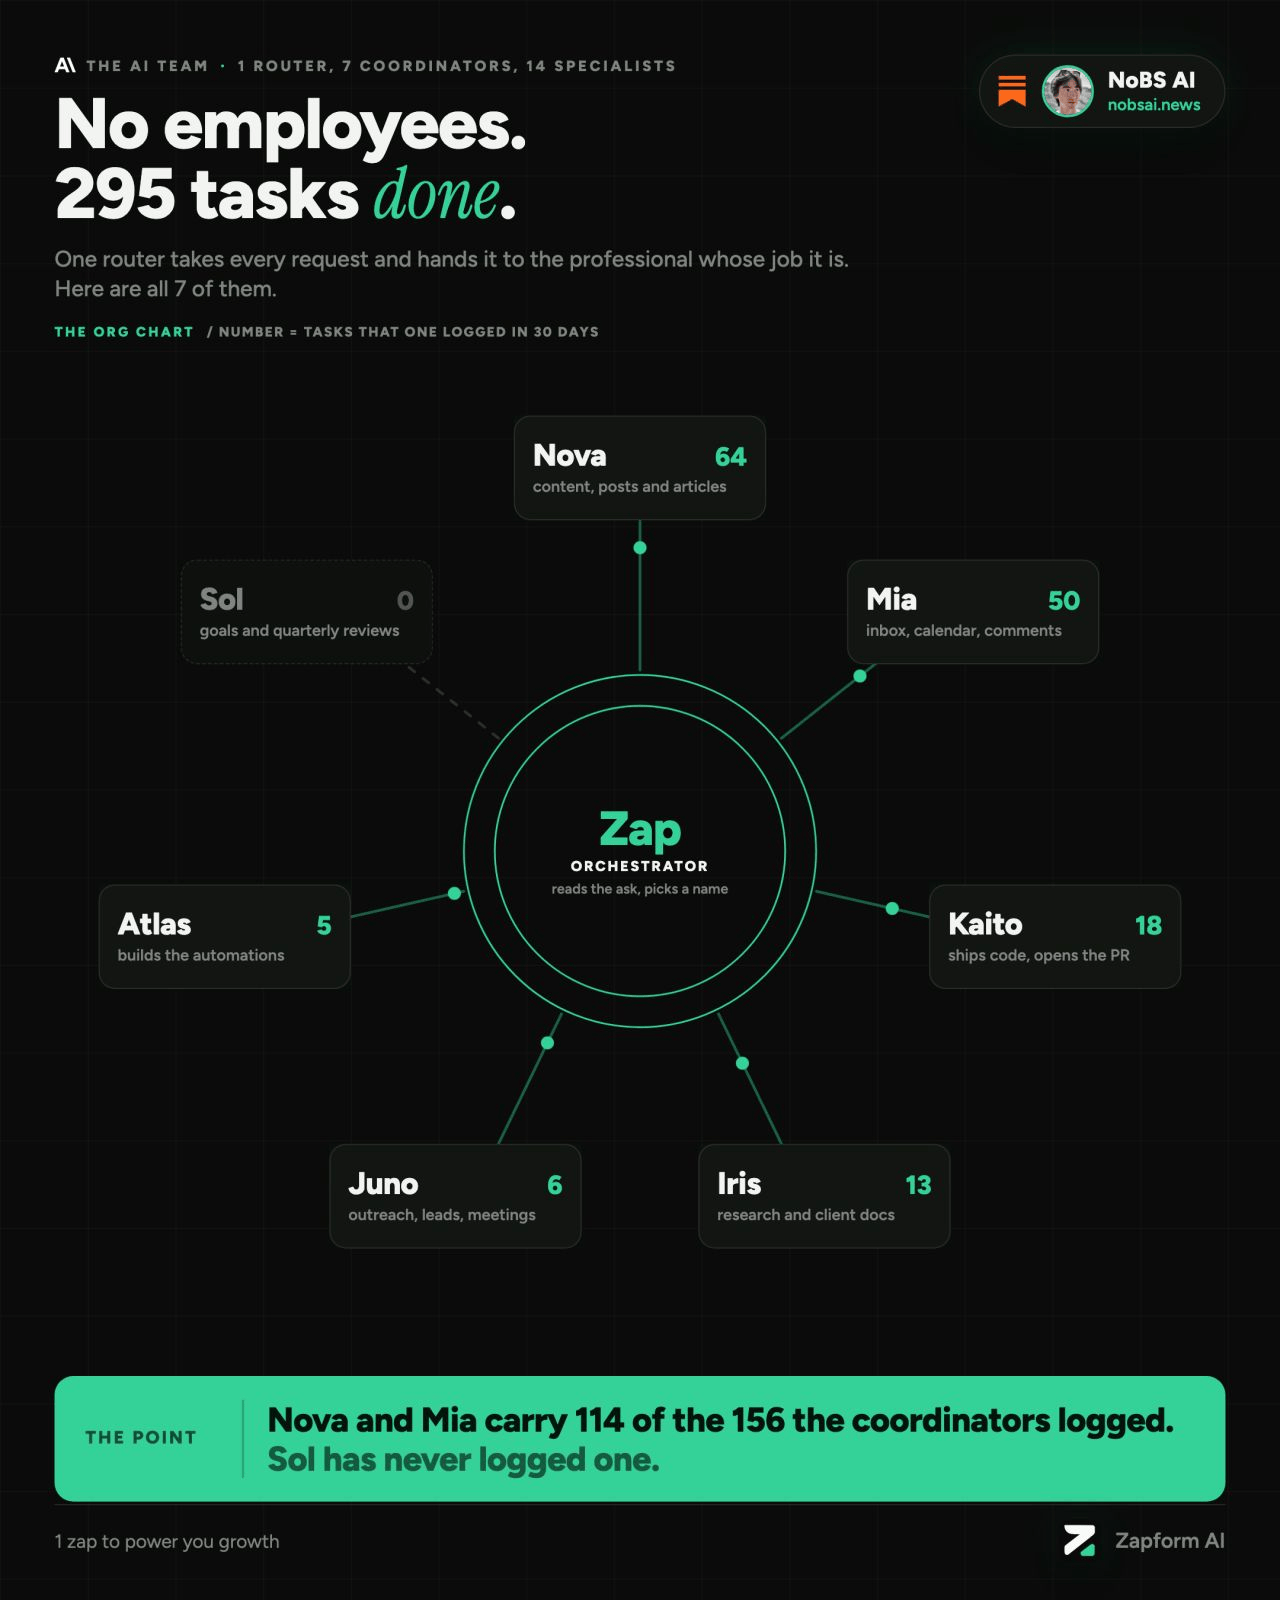
Making one is easy enough. Making a week of them is where it gets quite expensive, because every post needs a picture.
Subscribe to No BS AI. One real copy-pasteable build like this every week.
Quick disclaimer: I’m not a designer, and building them one at a time manually would really eat the whole day.
So I built a system for it, and a full week of visuals now takes me 15 minutes from the first block to the last export. Every picture comes out on the same canvas with the same accent and the same font, so a week of posts looks like one set coming from a brand.
So here’s what you’ll have by the end of this article:
Your own brand palette and fonts, set once and reused on every picture.
An HTML template and a library of components to fill it with.
One prompt that builds both and turns them into a skill that makes these infographics for you, like mine does.
In today’s article I’ll be explaining to you how you can create these kind of visuals too, let’s dive deep.
The main idea
To make the long story short: every infographic I post is the same HTML page underneath (HTML is the code a web page is made of). There’s one template with my colors and fonts already set, and a library of ready-made components I fill it with: a title, a few stat cards, a checklist, a comparison, whatever the post needs.
Think of it like a template of HTML elements that you fill on a blank canvas.
The design work happens once, when you build the template and the components. After that, a new infographic is me (or my AI assistant) picking a layout and dropping the right pieces into it. That’s really the whole idea, nothing too sophisticated.
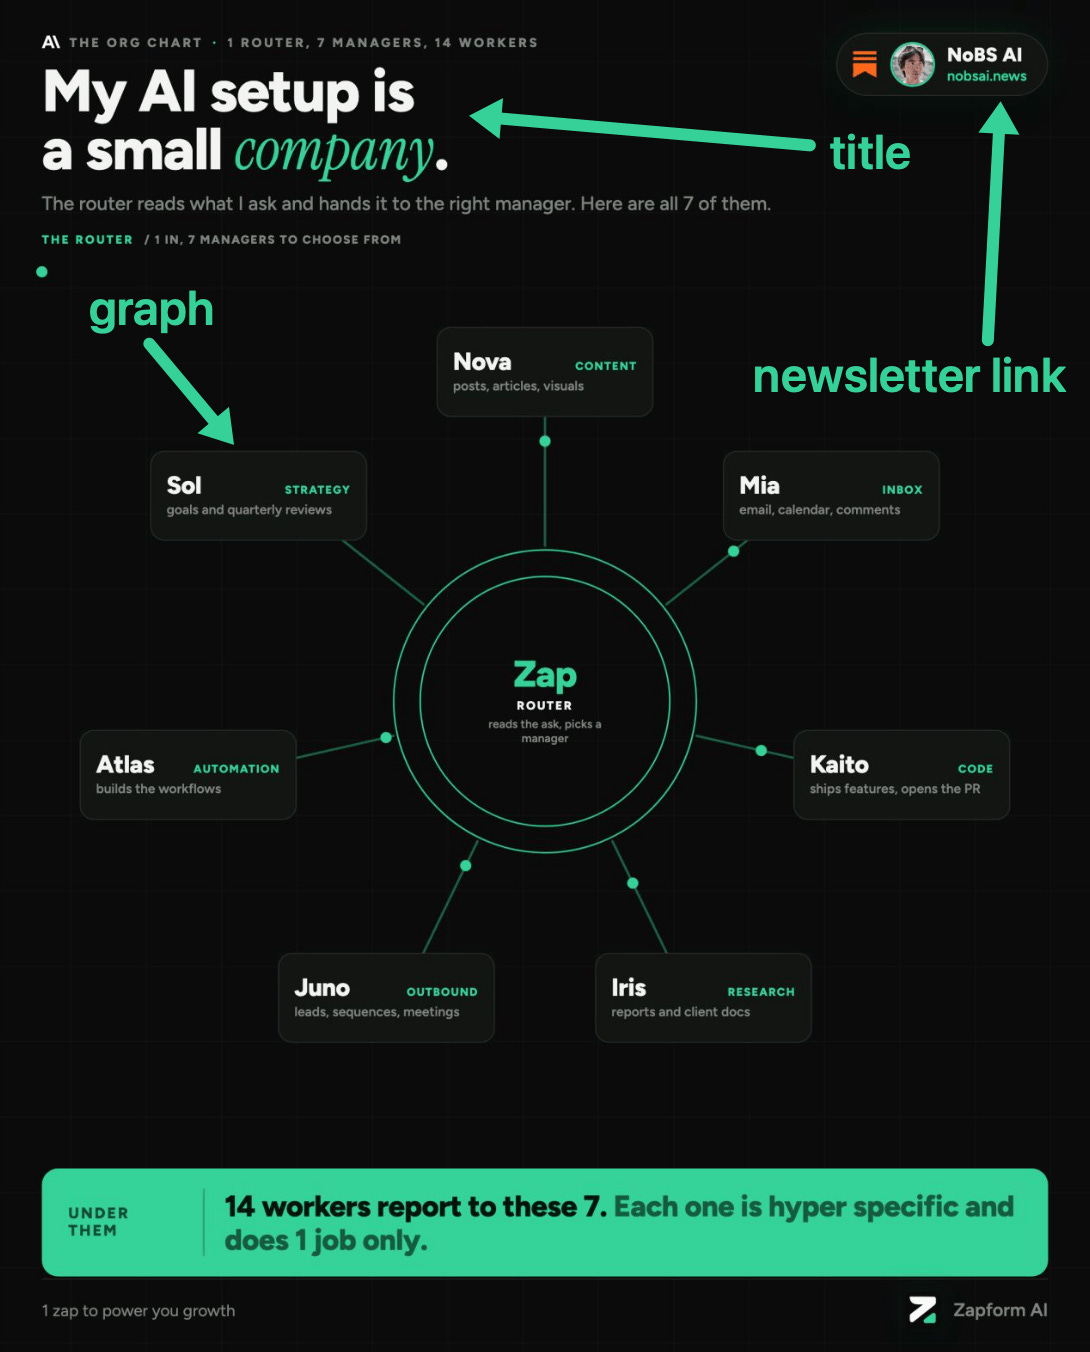
Here’s one of the 2 examples from above, taken apart into its pieces:
Your own brand palette and fonts
Everything starts here, because every component later pulls its colors and fonts from this one place.
Mine is about as simple as it gets: a near-black background, one emerald green accent and some fancy fonts here and there.
I believe one accent color is more than enough for most people starting out. With two or three there is still too much of a choice overhead.
All the colors and fonts live in just one file, each one saved under a name (accent, background, card, text and so on). If I want a different green tomorrow, I change it in that file and the change is applied to all future infographics.
The canvas size is fixed as well, 1080x1350, a portrait shape that sits well in a LinkedIn feed and in a Substack post. I also keep a light version of the same palette, and a small script makes the light copy of any infographic from the dark one, so I get both without building anything twice.
The HTML template and the component library
The template is the blank canvas I have: it’s fixed size, it has margins, the background and the brand file already loaded. The component library is everything you put on it.
Mine has 50 components by now. They go from the basics (titles, subtitles, dividers, a byline with my logo) to callouts, stat cards, checklists, do/don’t pairs, before/after panels, comparison tables, process flows with arrows, small charts and more.
On top of the components sit the layouts. A layout is the skeleton for one kind of post: a stat sheet for headline numbers, a 2x2 for frameworks, a dense grid for cheat sheets, a timeline for step-by-step plans, a comparison for A vs B. I have 9 of them built right now.
There’s one rule on top of all this: you pick a layout, fill it with components and leave the styling alone. The moment you restyle one post by hand, it stops matching the rest of the week.
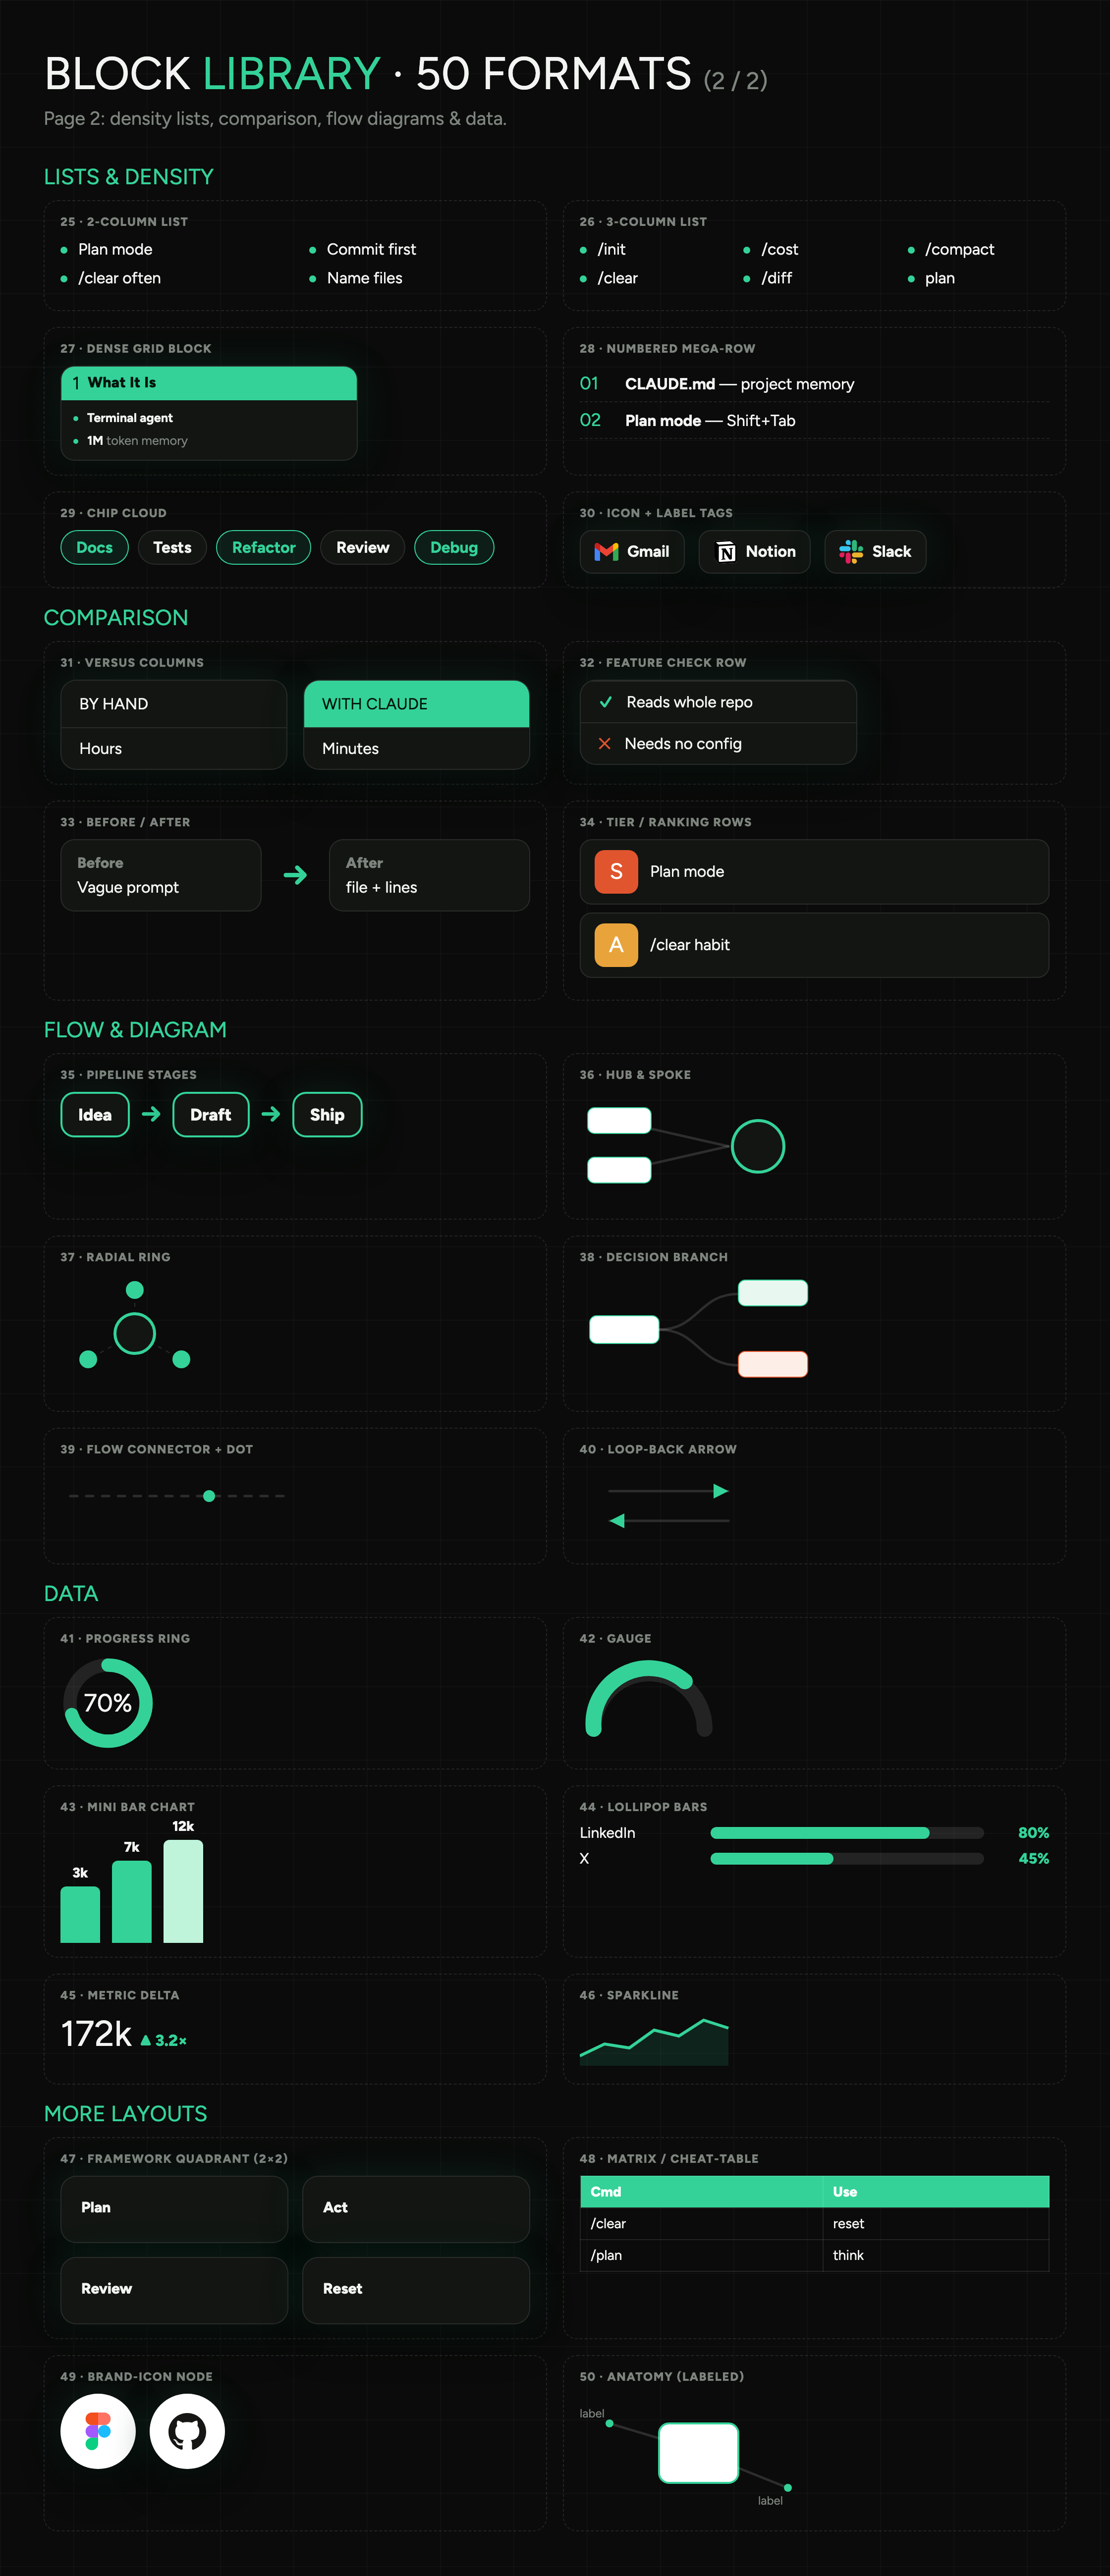
In practice
Here’s the prompt. Paste it into your AI assistant (I use Claude Code, but any assistant that can create files and run code will do) and answer its questions.
It works in 3 steps:
First it calibrates your palette and fonts, asking you a few questions and showing you 3 options to pick from.
Then it builds the HTML template and the component library on top of the palette you chose.
Finally it turns everything into a skill (a saved set of instructions your assistant loads every time you ask for an infographic), so you only explain all of this once.
Subscribe to No BS AI. One real copy-pasteable build like this every week.
I want you to build me a system that makes on-brand infographics for my social posts. Work through the 3 steps below in order, and stop for my answer wherever a step says to.

STEP 1. CALIBRATE MY BRAND PALETTE AND FONTS
1. Ask me these questions in one message, then wait for my answers:
   - What is my brand or name, and what do I post about?
   - Do I already have brand colours, a logo or a website you should match? If yes, I'll paste them.
   - 3 words for how the visuals should feel (for example: calm, technical, bold).
   - Dark background, light background, or both?
2. From my answers, propose 3 different palettes. Each one has a background colour, a surface colour for cards, a main text colour, a muted text colour, a border colour and ONE accent colour. Pair each palette with one Google font for headings and body, plus an optional monospace font for labels and code, plus an optional italic accent font used on about 10% of the text (the highlighted word in a title and the big numbers).
3. For each option, build a full-size 1080x1350 preview canvas, filled the way a real dense post would be: a small label above the title, a title with the accent on one word, a one-line subtitle, a strip of 3 stat cards, a numbered list next to a do/don't box, a small bar chart next to a progress ring, a tip, and tags with a byline at the bottom. Render all 3 to one PNG so I can see them side by side, and fix anything that overflows the margins before showing me.
4. Wait for me to pick one or ask for changes.
5. Save the winner as brand.css: every colour, font, font size, spacing value and corner radius as a CSS variable. If I asked for both dark and light, add the light version as a second set of the same variables. From now on nothing gets a colour or a font that is not in this file.

STEP 2. BUILD THE HTML TEMPLATE AND THE COMPONENT LIBRARY
1. Create template.html: a fixed 1080x1350 canvas (portrait, fits LinkedIn and Substack) that loads brand.css, with safe margins and an empty area where the content goes.
2. Add a library of reusable components to brand.css, each one styled only through the variables from step 1. At minimum:
   - title with one highlighted word, subtitle, small label above the title, divider, byline with my name or logo
   - stat card, and a strip of 3 to 4 stats
   - callout box, tip, warning
   - numbered step, checklist, do/don't pair, pros and cons
   - quote, short code snippet, tag chips
   - 2 or 3 column comparison, before/after, ranked tiers
   - process flow with arrows, hub with spokes, timeline
   - bar chart, progress ring, metric with an up/down change
3. Create at least 5 layout families, each a ready HTML file built only from those components: stat sheet (headline numbers), 2x2 framework, dense cheat-sheet grid, comparison (A vs B), process flow or timeline.
4. Write LIBRARY.md: every component with its class name and one line on when to use it, and every layout family with the kind of post it suits.
5. Render one catalog page showing every component, plus one PNG of each layout family filled with sample text, so I can review them. Fix anything that overflows, overlaps or is too small to read on a phone.
6. Rules for everything after this step:
   - A new infographic is made by picking a layout family and filling it with components. Never invent new styles, colours or fonts inside a single infographic.
   - Dense by default. Every infographic fills the whole canvas inside the margins with 8 to 12 components, packed into cards that sit side by side, with no empty band taller than about 100px. Text stays short, and nothing is smaller than 20px on the 1080px canvas so it still reads on a phone.

STEP 3. TURN IT INTO A SKILL
1. Create a skill called "infographic" (a reusable instructions file you load every time I ask for an infographic) in the place where your skills live. Put brand.css, template.html, the layout families and LIBRARY.md inside the skill folder, plus a script that renders an HTML file to a 1080x1350 PNG with a headless browser.
2. The skill's instructions say: when I give you a topic, a post or a list of points,
   a. pick the layout family that fits best and tell me why in one line
   b. fill it with components from LIBRARY.md only
   c. keep it dense: 8 to 12 components filling the canvas, each piece of text short enough to read on a phone
   d. render the PNG
   e. look at the PNG yourself and fix any overflow, clipped text or empty space before showing it to me
   f. save the HTML and the PNG in a dated folder
3. When I ask for a week of visuals, the skill takes the whole list of posts and makes one infographic per post in a single run.
4. Test the skill on one topic I give you, show me the result, and update the skill if I ask for changes.
Once the skill exists, a new infographic is one message. Mine works like this: I give it a topic or a post, it builds 3 versions with a different layout, density and angle, ranks them, and I pick one. Then it renders the PNG for the feed, and a GIF or MP4 when I want a moving version.
For a full week I hand it the whole list of posts in one go, and the last batch took me 15 minutes from start to finish. It has made 48 infographics for my posts so far.
I still add a new component whenever a post needs something the library can’t do yet.
Talk soon, Ilya